
The counties of Cochise, Gila, Graham, Greenlee, La Paz, Maricopa, Pima, Pinal, Santa Cruz, and Yuma in the State of Arizona
The counties of Imperial, Los Angeles, Orange, Riverside, San Bernardino, San Diego,and Ventura in the State of California

The counties of Catron, Chaves, Dona Ana, Eddy, Grant, Hidalgo, Lincoln, Luna,Otero, Sierra, and Socorro in the State of New Mexico

The counties of Atascosa, Bandera, Bee, Bexar, Brewster, Brooks, Cameron, Coke, Concho, Crane, Crockett, Culberson….
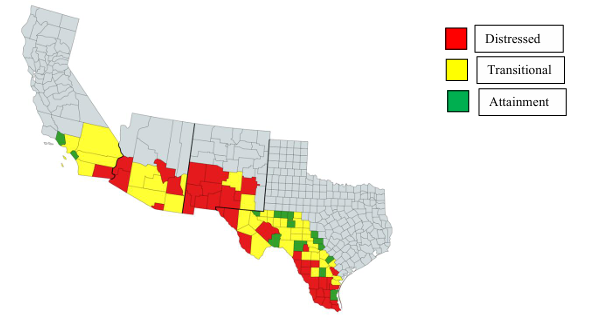
 Of the SBRC’s ninety-three counties, thirty-seven qualify as Distressed Counties, forty-one qualify as Transitional Counties, and fifteen qualify as Attainment Counties. Approximately 3.7 million people in the SBRC live in Distressed Counties. These counties have 11% of the commission’s total population but represent over double, 24%, of the commission’s population living in poverty. The majority of the commission’s population, 77%, reside in Transitional Counties, and Attainment Counties represent 12% of the commission’s population.
The commission’s average poverty rate of 18% is significantly higher than the national average of 12.6%. It represents an estimated 5 million people living in poverty. In addition, the commission’s unemployment rate is 6.5%, and the percentage of College Graduates is 31.8%, compared to the national average of 5.5% and 33.7%, respectively.
SBRC’s race and ethnicity statistics estimates are based on the five-year American Community
Survey (ACS). The commission’s population is composed of the following:
▪ 48.1% – Hispanic or Latino
▪ 33.7% – White alone, not Hispanic
▪ 5.2% – Black or African American alone, not Hispanic
▪ 0.6% – American Indian and Alaska Native alone, not Hispanic
▪ 9.2% – Asian alone, not Hispanic
▪ 0.2% – Native Hawaiian and Other Pacific Islander alone, not Hispanic
▪ 0.2% – Other Race alone, not Hispanic
▪ 2.8% – Two or More Races, not Hispanic
❖ The commission’s minority population comprises 66% of its total population.
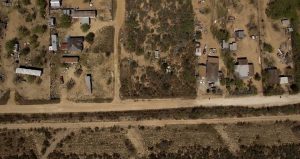 Colonias are some of our nation’s poorest communities and lack a substantial tax base. A “Colonia,” Spanish for neighborhood or community, is a geographic area located within 150 miles of the US-Mexico border that has a majority population composed of individuals and families of low and very low income. These families lack safe, sanitary, and sound housing and are without basic services such as potable water, adequate sewage systems, drainage, utilities, and paved roads. An estimated 800,000 people lack adequate drinking water and sanitation facilities, such as household plumbing or proper sewage disposal systems. Approximately one third have no drinking water or wastewater facilities. The Rural Community Assistance Partnership (RCAP), a national non-profit studying access to water, estimates that these historically underinvested communities, known as “Colonias” need over $10 billion in water and wastewater infrastructure investment across the four Border States (CA, AZ, NM & TX). Even many of those living in colonias with access to water have issues with quality and quantity and face health risks from the lack of adequate water or wastewater service. To provide safe and clean drinking water and sanitation facilities effectively to these minority and historically underserved communities, we need to increase federal investments. All communities defined as colonias reside in the commission’s service area. The SBRC is workingwith RCAP to update their study.
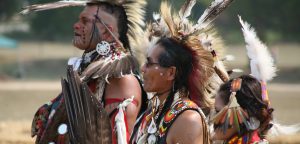 The SBRC region is home to fifty-one federally recognized tribes. The SBRC is the only commission with statutorily mandated tribal participation. According to census data, collectively, the tribal communities in the SBRC’s region have a poverty rate of forty-four percent and an unemployment rate of twelve percent, compared to the U.S. averages of twelve and four percent, respectively. Tribal communities have severe infrastructure challenges, including a lack of drinking water, sanitation facilities, and broadband access. According to the Universal Access to Clean Water for Tribal Communities Project. 48% of Tribal homes do not have access to reliable water sources, clean drinking water, or basic sanitation. SBRC seeks to enhance Tribal capacity and promote self-governance. The commission is committee to setting aside at least five percent of our total grant funds for tribal communities.
A 2022 study from Columbia University Mailman School of Public Health has revealed that Latino and Native American communities across the US are disproportionately exposed to significantly higher levels of arsenic and uranium in public drinking water, underscoring severe environmental injustices that persist. This is true for the communities in our region. We examine this further in the section labeled Advancing and Delivering on Environmental Justice on page 18 of this document.
 There is a gap between the Federal Communications Commission’s (FCC) reported broadband capabilities in a county and the Census Bureau’s data on the percentage of households reporting a broadband internet subscription in the same county. Commission counties have an average twenty four percent gap between broadband coverage and a broadband subscription. However, it’s the Rural, Distressed Counties and tribal areas that bear the brunt of this issue. In half the commission’s counties, there is a discrepancy of thirty-three percent between the available coverage and utilization. Of these counties, seventy-three percent are rural, and fifty-three percent are economically distressed. The commission’s ten most impacted counties have a gap of forty-three percent and are all rural counties, with half being economically distressed counties. More clarity is needed on the accessibility and utility of broadband in these communities. The commission is committed to analyzing this issue further and collaborating with our communities to increase real broadband access.
 The counties within the commission’s region are facing a critical shortage of healthcare professionals, with every county designated a Health Professional Shortage Area (HPSA) for primary health, mental, and dental care by the U.S. Department of Health and Human Services (HHS).
Primary care HPSA status is determined using four key criteria: the population-to-provider ratio, the percentage of the population below 100% of the Federal Poverty Level (FPL), infant health indicators such as infant mortality rate or low birth weight, and the travel time to the nearest alternative source of care outside the assessed area. Scores range from 0 to 25, with higher scores indicating a more severe shortage.
Among the commission’s ninety-three counties, seventy-seven percent are classified as whole county Primary Care HPSAs by HHS.
In economically distressed counties within the commission’s jurisdiction, thirty-six out of thirty seven are designated whole-county Primary Care HPSAs, with an average shortage score of 16. The ten counties experiencing the most severe shortages have an average score of 19.
In counties classified as transitional, seventy-five percent (twenty-seven counties) are designated as whole-county Health Professional Shortage Areas, with an average score of 14.
For the commission’s attainment counties, nine out of fifteen are whole-county Health Professional Shortage Areas, with an average score of 12.
This shortage of healthcare providers presents a significant barrier to equitable healthcare access across our region. The commission considers this a critical workforce issue. It is committed to helping address it, particularly in our most rural and underserved areas, by supporting healthcare professionals’ training, recruitment, and retention through grant programs and collaborative partnerships with state health agencies, including continuing to utilize our J-1 Visa program.